EXCEL SIR Model
This is a simple SIR model, implemented in Excel (download from this link). Please experiment with the parameters at the top to see the effect on outcomes.
- Can you push the shape of the Predicted (Cumulative) Deaths curve around?
- What are the tradeoffs you can make?
- Can you make it rise sooner or later, rise faster or slower, etc?
- Can you make it asymmetrical or will it always be symmetrical?
in the Excel example, the Beta and Gamma rates are currently constant, which means that the R0 value will be constant.
Here are some explanations to how the parameters were used in Excel.
* Beta is Infectious rate per day
* Gamma is the Recovery rate (inverse of number of days infectious)
* R0 ("R naught") is Beta / Gamma: the number of people infected, on average while infectious
* Lambda is the rate of movement from exposed to infectious per day
* Delta is the rate of death for those who enter an infectious state
* Euler Method: bound error wikipedia page
You could add a Beta column to the right of the I -> R column, below, and have a different Beta for each day, effectively changing R0.
You'd want to start by copying the same Beta value to all rows, then change the formulas to use these cells and make sure you
can reproduce
the same results. Then try having one value for a certain number of days and a second
value for the rest of the days, as if behavior suddenly changed.
You could also ramp the value from one value to another to reflect a more realistic change. (I will post something similar with a more sophisticated model in R.)
This model is strictly deterministic. Think about the following questions:
- What points in the calculation should actually have uncertainty associated with
them?
- How might you reflect multiple uncertainties in this model?
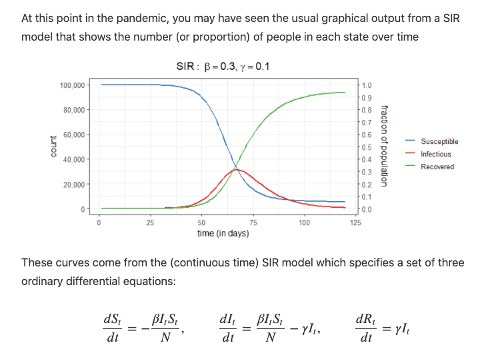
General SIR Parameters are listed bellow:
* Beta How often contact between a Susceptible individual and an Infectious individual results in infection, also known as the transmission rate.
* Lambda The rate at which Exposed individuals become Infectious.
* Gamma The rate at which Infectious individuals recover and become Removed.
* Delta The percentage of infections that result in Death.
* Mu The percentage of those who do not follow the lockdown who mix with those who do.
The key parameter that you read about in the news is R0 ("R naught"), the number of susceptible individuals infected by one infectious individual, on average. This value is simply `beta / gamma`.
Ex. if on average people are Infectious for 7 days, the recovery rate, Gamma, is 1/7: one seventh of the infectious population moves to Recovered each day.
In the real world, differential equations and their solvers would be used and you're free to explore that if you wish. Enjoy and let's talk about this online!
Play around. Code this up in R or use Tableau. More information to be added soon under the R section.
Some of the links on this page may require additional software to view.