Exploring School Data
Excellence Gap Chart Creator
- Access the Google Sheet here. (This will create a copy of the spreadsheet in your Google Drive for you to use.)
- Visit the Kentucky School Report Card at (kyschoolreportcard.com). Note: The data from the Kentucky School Report Card include Primary Talent Pool students as well as students formally identified as gifted. If possible, consider reviewing Primary Talent Pool data compared to formally identified data.
- Search for your district/school.
- Scroll down to Overview and click “Students” on the right-hand side.
- Under the Enrollment tab, you will find your overall student numbers in the “Total Student Count” table.
- In the Google Sheet, enter the overall numbers in the shaded cells (B2, C2, etc.). (This should be the overall number, not a percentage. The Google Sheet is set to automatically calculate the percentages.)
- After you have finished entering the data for all students, you will need to access
the gifted enrollment data. To do this:
- Click on “Educational Opportunity” in the left sidebar of the School Report Card.
- Options will appear under Educational Opportunity in the left Click on “Gifted and Talented.”
- In the Google Sheet, enter the gifted numbers in the shaded cells (B3, C3, ).
- In the blue shaded cell (B5), enter the title as you would like it to appear on the chart.
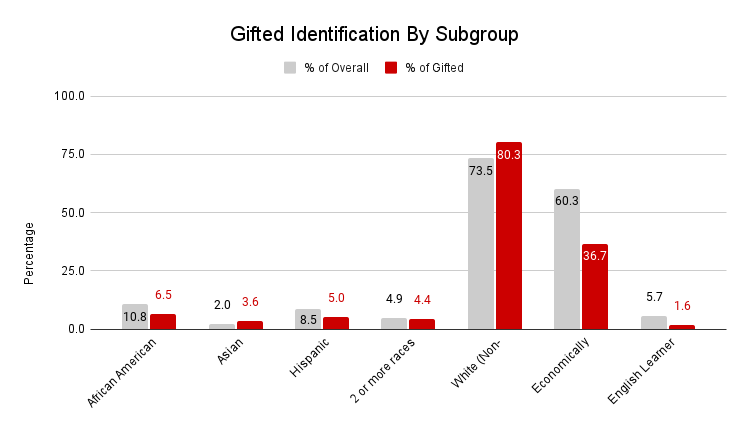
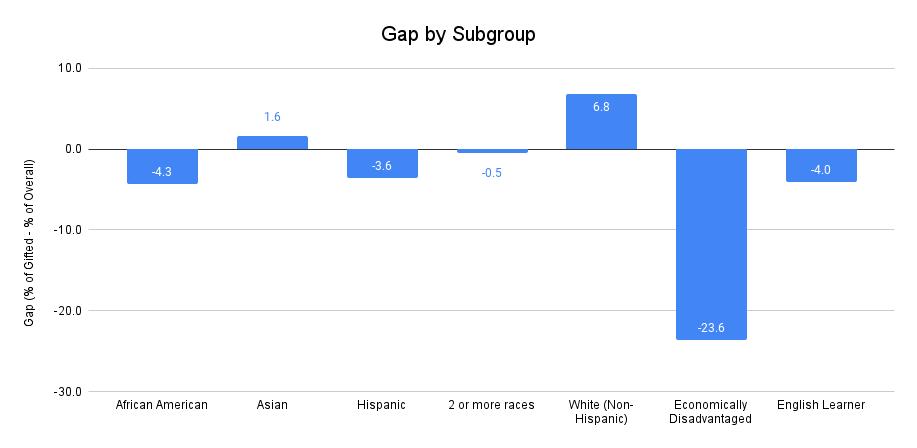
The Google Sheet will automatically generate two charts (examples below). The first chart shows a clustered bar chart showing the percent of the overall population by subgroup in grey and the percent of gifted by subgroup in maroon. The second chart shows the gaps by subgroup. It is generated by taking the percent of gifted minus the percent of overall. Negative gaps indicate underrepresentation and positive gaps indicate overrepresentation. Ideally, the gap would be zero for all subgroups.
If you have any questions, please reach out to Tyler Clark (thomas.clark@wku.edu).
Example
The charts below were generated using 2022 data from the Kentucky School Report card for the entire state.
Some of the links on this page may require additional software to view.